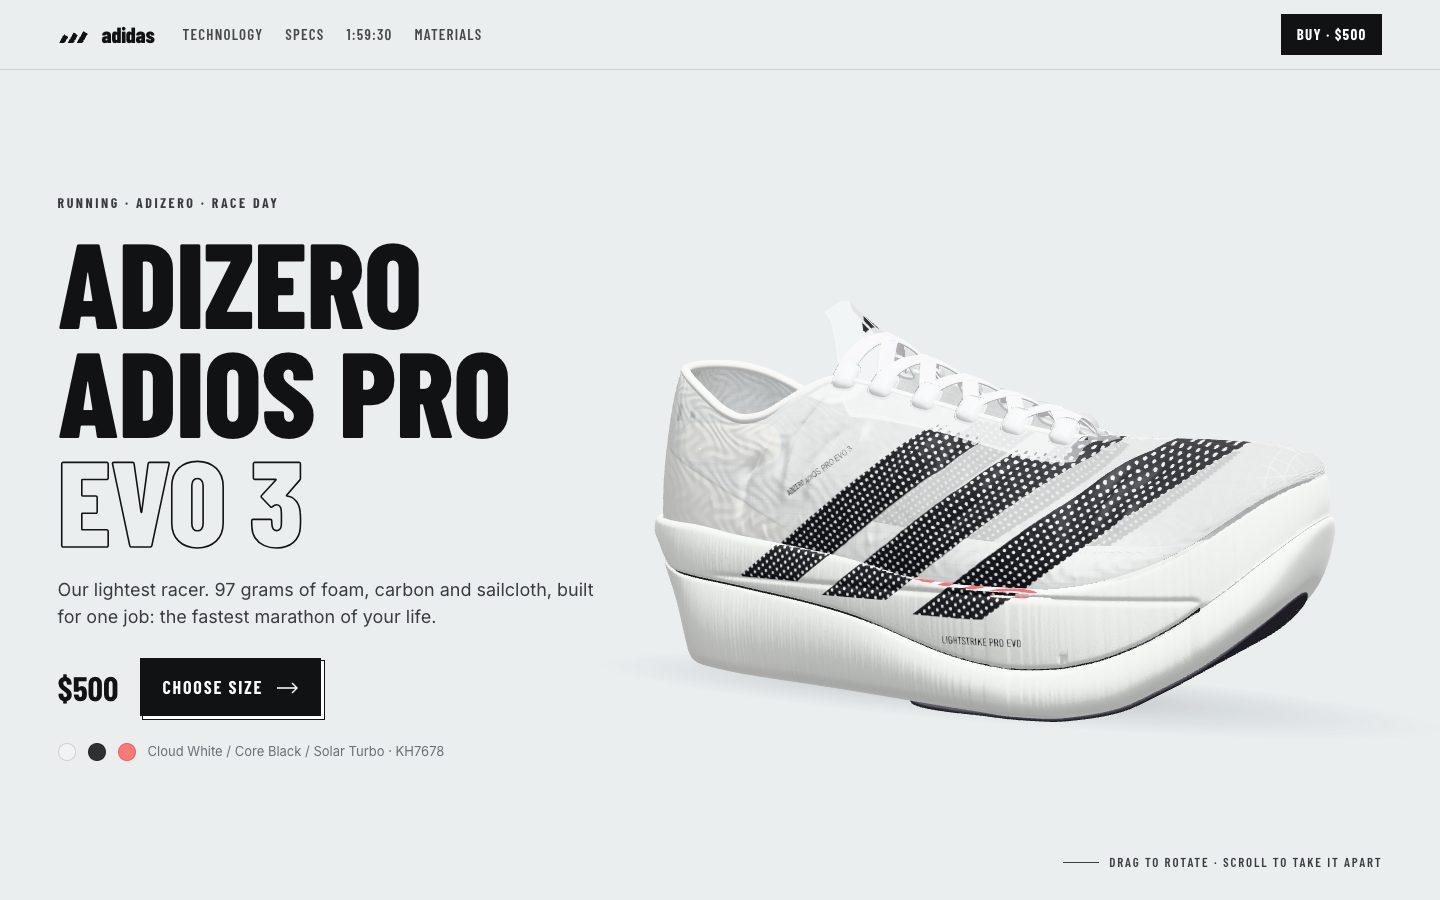
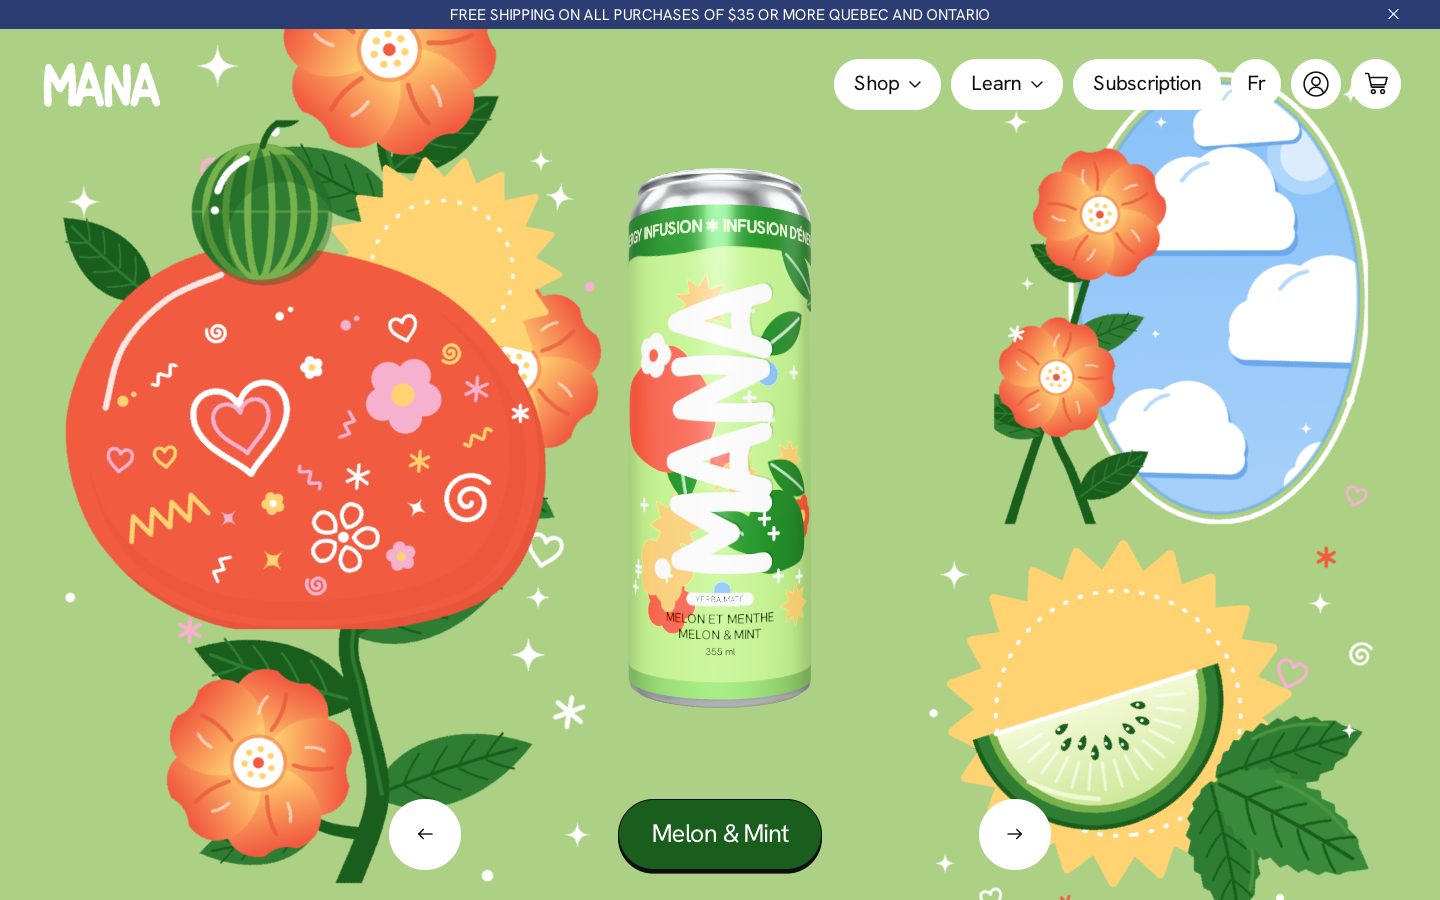
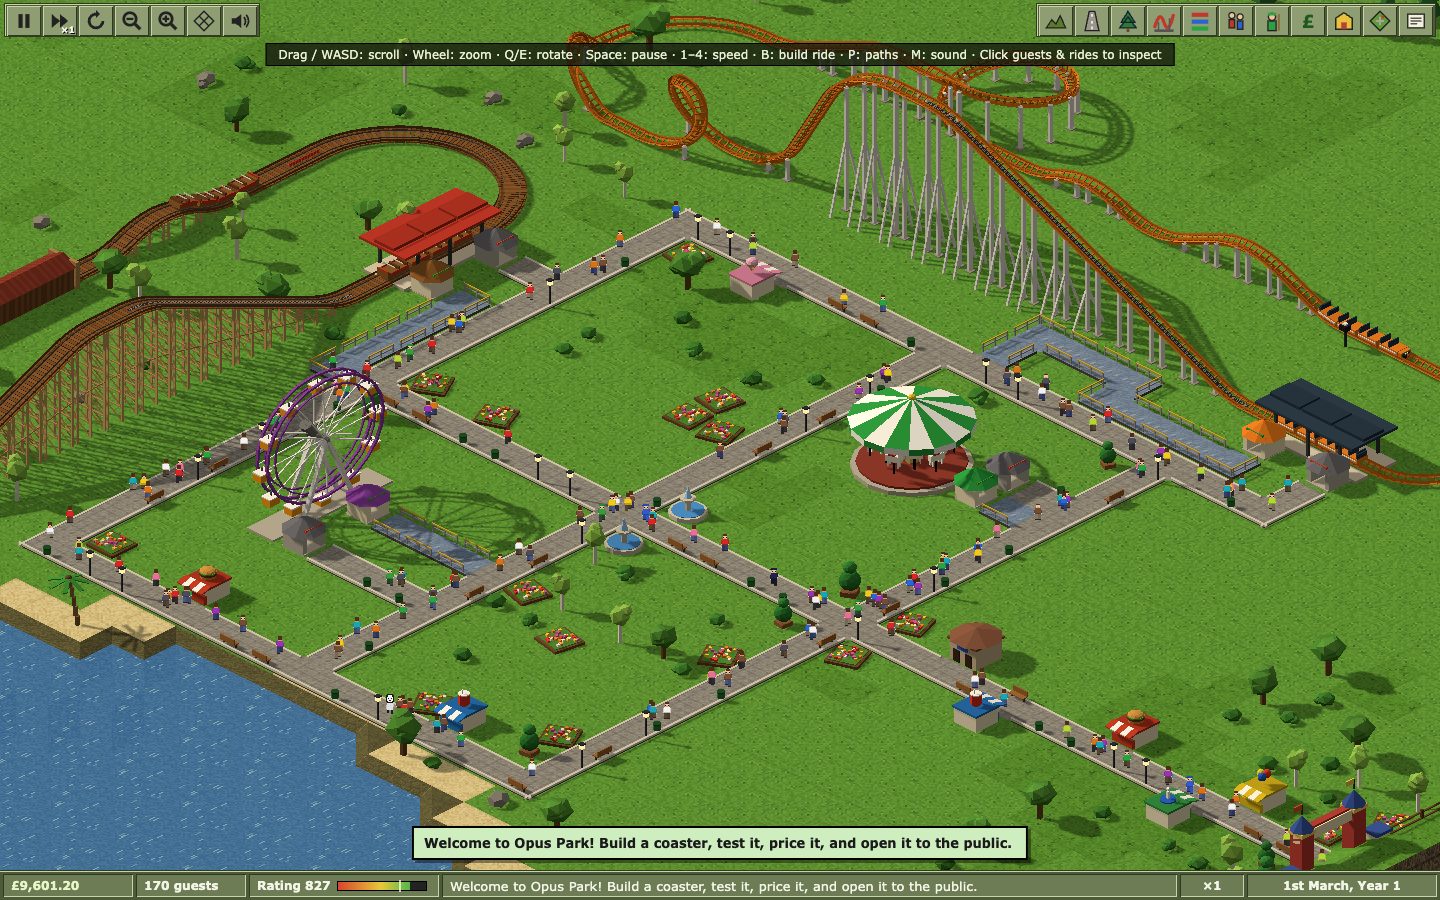
The prompt
# Lightning Round — Test 1: Research Report

Blind side-by-side. Same prompt to both models. Judged on: quality of the research,
quality of the writing, and quality of the document design.

---

Research and write a complete, publication-quality report answering the question:
**"Are data centers bad for the environment?"** — with a particular focus on **water
consumption** alongside energy use and emissions.

Deliver it as a **single self-contained HTML document** that is designed, not just
formatted — this should look like something a serious publication would put its name
on.

## The research
- Do real research. Use actual figures — water withdrawal vs. consumption, gallons per
  megawatt-hour, energy draw, PUE and WUE, regional water stress where major data
  centers sit, and the AI-driven growth curve.
- **Cite every number** with a linked source. Do not invent or estimate statistics — if
  you can't source it, leave it out.
- Present the honest picture, including the counterarguments (efficiency gains,
  renewable siting, closed-loop cooling, how data center use compares to agriculture
  and other industries). Do not write an advocacy piece in either direction.

## The writing
- Lead with a clear, direct answer, then support it.
- Plain, confident prose — no hedging filler, no marketing language.
- Structure it so a smart non-expert can follow: what the concern is, what the data
  actually shows, where it's genuinely bad, where it's overstated, what happens next.

## The design
- Treat typography as the foundation: a considered type scale, generous measure, real
  hierarchy.
- Include **data visualizations you build yourself** (inline SVG or canvas) for the key
  figures — no image files, no chart libraries pulled from a CDN.
- Considered color palette, well-set tables, pull quotes, footnotes/citations styled
  properly.
- Fully responsive and printable.

## Iteration
Before you call it done, do **at least three iteration passes**: go back through the
report with a fine-toothed comb looking for weak sourcing, flabby writing, design
problems, and opportunities to improve it. Fix what you find.

Return the complete HTML document, ready to open.
The exact prompt from the published test.
The builds
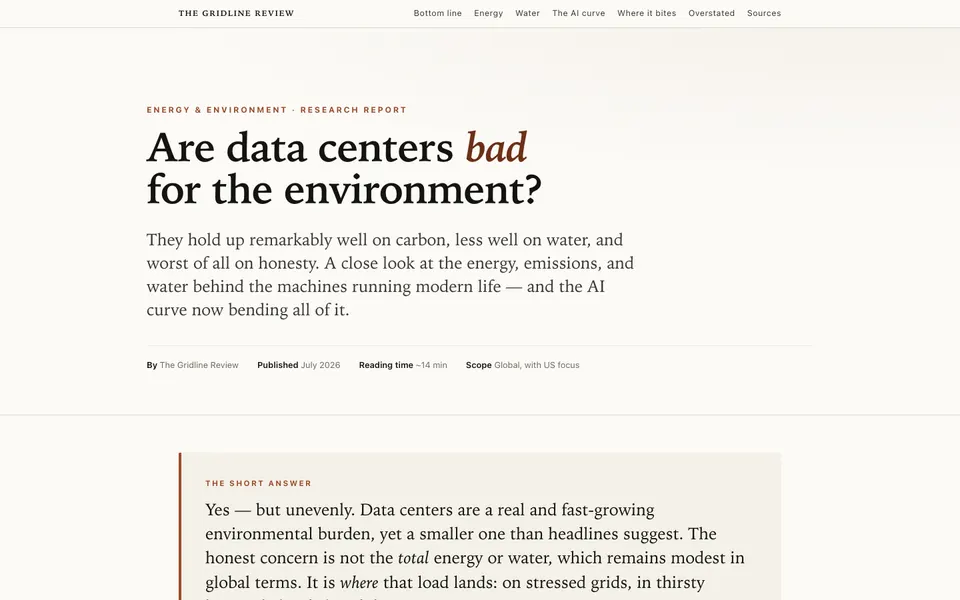
GLM 5.2 · Screenshot of the buildRuns in your browser
Featured in
GLM 5.2 vs Kimi K3: Which Open Source Model Wins?
This build’s chapter starts at 22:45.

Written by
Pat Simmons. Pat tests AI models and tools on the AI for Mortals YouTube channel.